source: https://bost.ocks.org/mike/
Mike Bostock
March 9, 2016What Makes Software Good?
December 28, 2015Introducing d3-scale
December 3, 2015Introducing d3-shape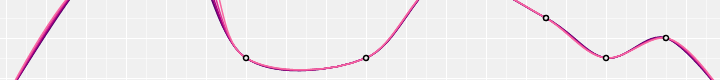
November 23, 2015Let’s Make a (D3) Plugin
December 27, 2014Mapping Every Path to the N.F.L. Playoffs
December 20, 2014How Each Team Can Make the N.F.L. Playoffs
November 5, 2014The Most Detailed Maps You’ll See From the Midterm Elections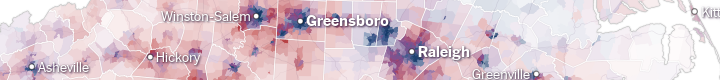
November 3, 2014How To Scroll
September 19, 2014‘Stop-and-Frisk’ Is All but Gone From New York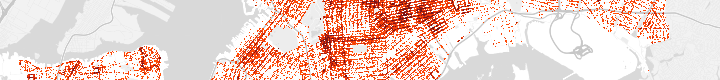
July 26, 2014Mapping the Spread of Drought Across the U.S.
June 26, 2014Visualizing Algorithms
June 15, 2014Three Little Circles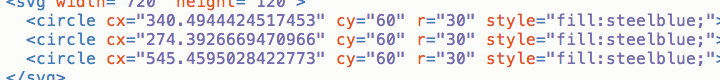
May 22, 2014Is It Better to Rent or Buy?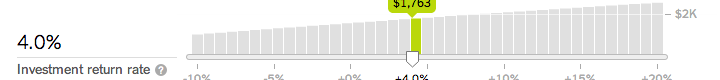
May 6, 2014Let’s Make a Bubble Map
April 22, 2014Who Will Win The Senate?
March 7, 2014Let’s Make a Block
Feburary 14, 2014Front Row to Fashion Week
February 14, 2014Sochi 2014: Interactive Stories
January 11, 2014Taking the Battle to the States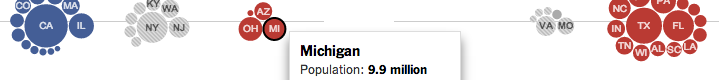
November 30, 2013Tracing the History of N.C.A.A. Conferences
November 5, 2013Let’s Make a Bar Chart, Parts 1-3
October 27, 2013A Game of Shark and Minnow
October 14, 2013The Russia Left Behind
September 29, 2013For Eli Manning, 150 Games and Counting
September 25, 2013Oracle’s Path to Victory
September 23, 2013State-by-State Premiums Under the Health Care Law
September 6, 2013Constellations of Directors and Their Stars
September 2, 2013How To Infer Topology
August 2, 2013For Yankees, Little Bang for Their Buck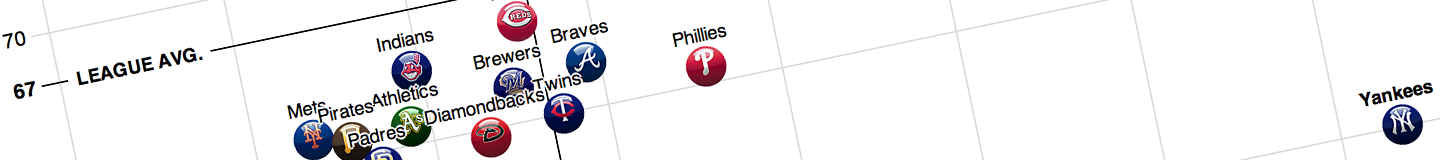
June 9, 2013For Example
May 25, 2013Across U.S. Companies, Tax Rates Vary Greatly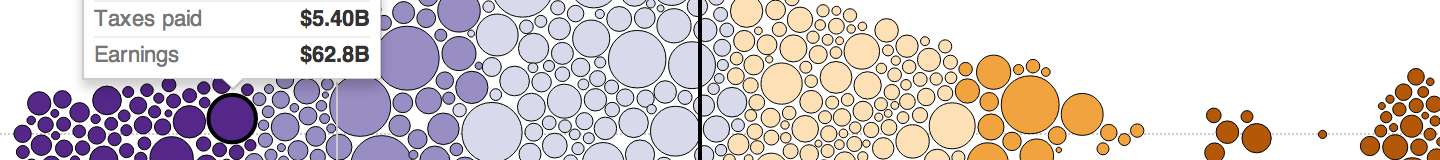
April 26, 2013How Selections Work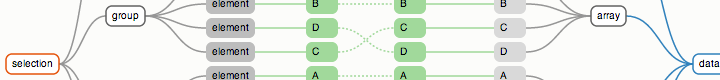
April 25, 2013N.F.L. Draft: How Good Are Teams at Picking the Best?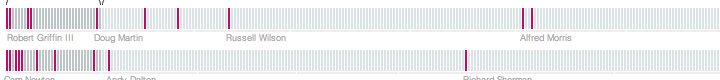

March 2, 2013Increased Border Enforcement, With Varying Results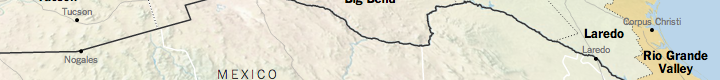
February 23, 2013Why Use Make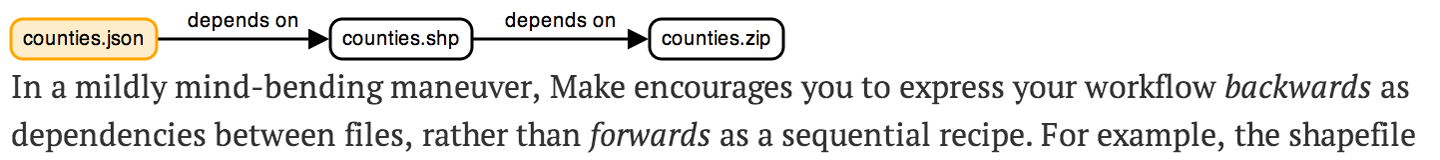
February 20, 2013Among the Oscar Contenders, a Host of Connections
January 3, 2013A Chicago Divided by Killings
December 30, 2012Let’s Make a Map
November 29, 2012How the Tax Burden Has Changed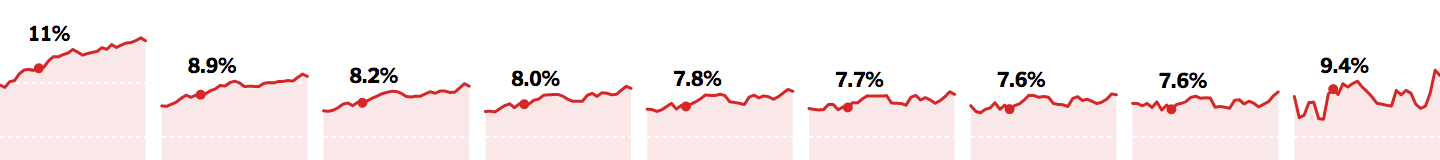
November 11, 2012Counties Blue and Red, Moving Right and Left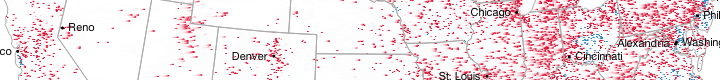
November 7, 2012How Obama Won Re-election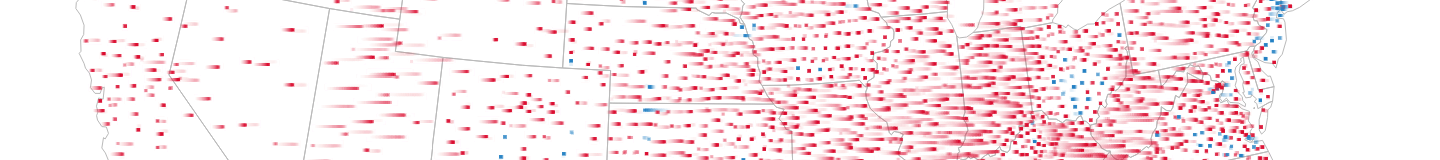
November 2, 2012512 Paths to the White House
October 30, 2012Wind Speeds Along Hurricane Sandy’s Path
October 24, 2012Working with Transitions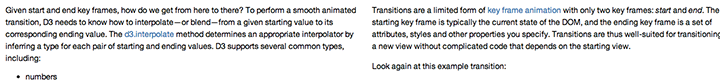
October 15, 2012Over the Decades, How States Have Shifted
September 18, 2012A Faded Piece of Papyrus Refers to Jesus’ Wife
September 14, 2012How the Chicago Public School District Compares
September 6, 2012At the National Conventions, the Words They Used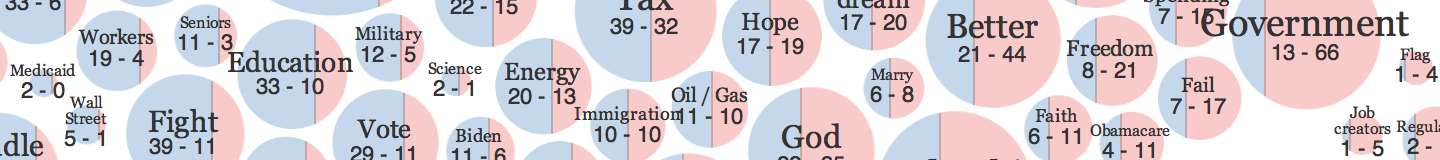
September 4, 2012At the Democratic Convention, the Words Being Used
August 28, 2012At the Republican Convention, the Words Being Used
August 24, 2012Drought during Month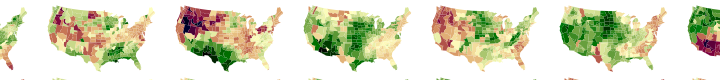
August 24, 2012Drought Extends, Crops Wither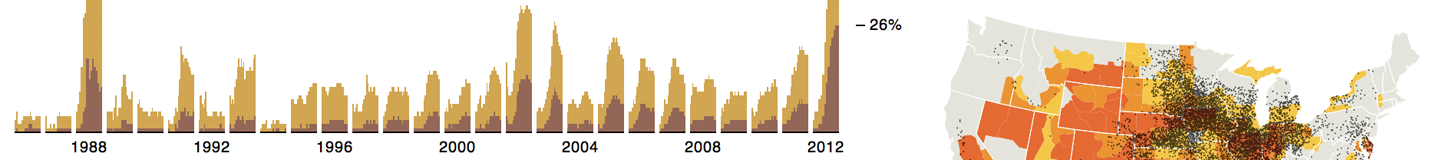
August 10, 2012Drought and Deluge in the Lower 48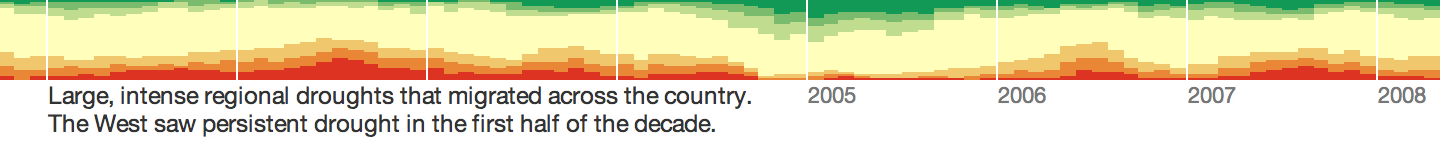
June 21, 2012Fisheye Distortion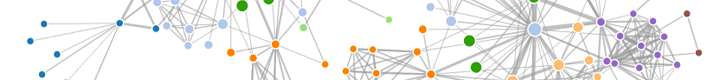
June 19, 2012D3 + Leaflet
June 10, 2012Zoomable Treemaps
June 1, 2012Line Simplification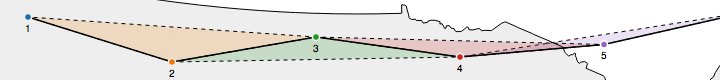
May 22, 2012Sankey Diagrams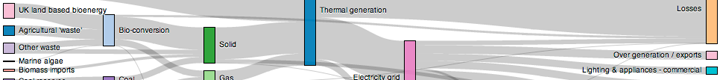
May 16, 2012Object Constancy
April 8, 2012Nested Selections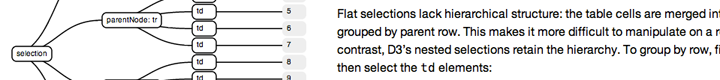
March 18, 2012Hive Plots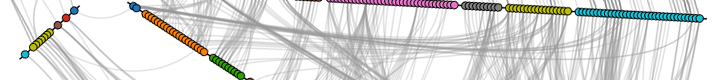
March 13, 2012The Wealth & Health of Nations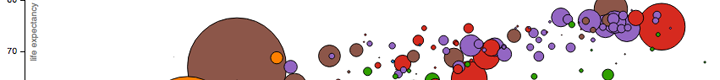
February 27, 2012Towards Reusable Charts
February 5, 2012Thinking with Joins
January 21, 2012Will It Shuffle?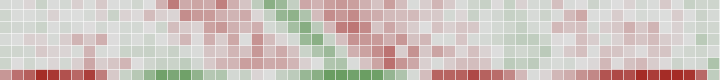
January 19, 2012Path Transitions
January 14, 2012Fisher–Yates Shuffle
January 12, 2012Les Misérables Co-occurrence
January 9, 2012Uber Rides by Neighborhood
#Examples
In addition to the graphics and articles listed above, I have posted almost a thousand examples on bl.ocks.org/mbostock. Peruse them to learn D3 or for visual inspiration.
#Talks
Occasionally I stand in front of a room of people and, by flapping my lips or waving my arms, attempt to communicate something of interest. These awkward moments are sometimes captured as moving images and sound for future study.
Q&A - September 8, 2015Reddit: AMA
Video - September 8, 2014FOSS4G: The Toolmaker’s Guide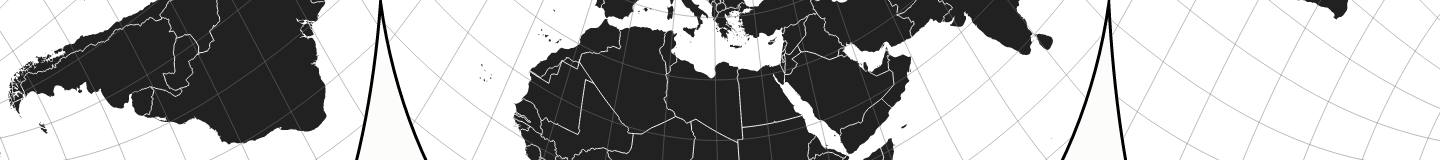
Video - June 11, 2014Eyeo: Visualizing Algorithms
Video - April 24, 2014OpenVis: Design is a Search Problem
Video - June 6, 2013Eyeo: For Example
Slides & Video - May 2, 2012Time Series Visualization with Cubism.js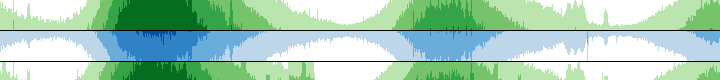
Slides - March 5, 2012VIZBI: D3 Workshop
Slides & Video - November 16, 2011W3C Conf: Visualizing Data with Web Standards
Slides - October 18, 2011SVG Open: D3 Keynote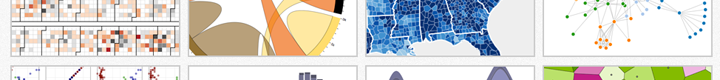
Slides & Video - September 21, 2011Trulia Meetup: Use the Force!
#Publications
As part of my PhD studies at the Stanford Vis Group, I published several papers with Jeffrey Heer.
Code as Cartography
The Cartographic Journal, May 2013
The Cartographic Journal, May 2013
D3: Data-Driven Documents
IEEE InfoVis 2011
IEEE InfoVis 2011
Declarative Language Design for Interactive Visualization
IEEE InfoVis 2010
IEEE InfoVis 2010
Crowdsourcing Graphical Perception: Using Mechanical Turk to Assess Visualization Design
ACM CHI 2010, best paper nominee
ACM CHI 2010, best paper nominee
Protovis: A Graphical Toolkit for Visualization
IEEE InfoVis 2009
IEEE InfoVis 2009
#Projects
Most of my recent projects are listed on my GitHub profile. If you want help using any of my libraries, please post questions to Stack Overflow with the appropriate tag (or the d3-js group) and I will endeavor to answer them.
D3.js
A JavaScript library for visualizing data and manipulating the document object model.
A JavaScript library for visualizing data and manipulating the document object model.
TopoJSON
An extension of GeoJSON that encodes topology.
An extension of GeoJSON that encodes topology.
Shapefile
A streaming parser for the ESRI Shapefile spatial data format.
A streaming parser for the ESRI Shapefile spatial data format.
U.S. Atlas
Roll your own TopoJSON from the National Atlas one million-scale dataset.
Roll your own TopoJSON from the National Atlas one million-scale dataset.
Cubism.js
A JavaScript library for time series visualization. Built on D3.
A JavaScript library for time series visualization. Built on D3.
Cube
A system for time series data collection and analysis. Built on MongoDB.
A system for time series data collection and analysis. Built on MongoDB.
Crossfilter
A JavaScript library for fast multi-dimensional filtering and grouping of data.
A JavaScript library for fast multi-dimensional filtering and grouping of data.
Stack.js
A presentation library with intuitive, scroll-based navigation.
A presentation library with intuitive, scroll-based navigation.
Queue.js
Yet another abstraction for asynchronous JavaScript. 554 bytes!
Yet another abstraction for asynchronous JavaScript. 554 bytes!
Polymaps
A JavaScript library for image- and vector-tiled maps.
A JavaScript library for image- and vector-tiled maps.
Protovis
A JavaScript library for visualization; superseded by D3.
A JavaScript library for visualization; superseded by D3.
Dependency Tree
A dependency visualization using hierarchical edge bundling.
A dependency visualization using hierarchical edge bundling.
Polly-B-Gone
A 3D physics platform game.
A 3D physics platform game.
No comments:
Post a Comment